
| Index | Highlights | Presentation | Publications | Data | Press & Media | Images |
Global Methane Budget
Highlights
 |
Context |
After carbon dioxide (CO2), methane (CH4) is the second most important well-mixed greenhouse gas contributing to human-induced climate change. In a time-horizon of 100 years, CH4 has a Global Warming Potential (GWP-100) 28 times larger than CO2. The level of CH4 in the atmosphere is over 150% higher than pre-industrial times (cf. 1750), and it is responsible for 20% of the global warming produced by all well-mixed greenhouse gases. Methane is transformed into water vapor in the stratosphere. Methane also produces ozone in the troposphere, which is a pollutant with negative impacts on human health and ecosystems. The atmospheric life time of methane is 10 ± 2 years. |
|
 |
Global Budget |
For the decade of 2003-2012, global emissions of methane are 558 (540-568) Tg CH4 per year as estimated from atmospheric inversions (top-down approach). The global CH4 sink is 548 Tg CH4 per year. The source–sink mismatch reflects, and is consistent with, the observed average imbalance in the atmosphere of 10 Tg CH4 per year (the CH4 growth rate). The sum of all sources as estimated from inventories and modeling (bottom-up approaches) is 736 (596-884) Tg CH4, 34% higher than estimated from the top-down approach and reflecting the compounded uncertainties of the multiple CH4 sources. |
|
 |
Trends |
The causes of the observed stabilization of atmospheric CH4 between 1999 and 2006 remains uncertain. Possible causes are the reduction in or stabilization of fossil fuel emissions, combined with the stabilization or increase in microbial emissions. Changes in the rate of destruction of CH4 by the OH in the atmosphere could have also contributed. After 2006, the renewed global increase in atmospheric CH4 is consistent with higher emissions from biogenic sources, and given the global stability of wetland emissions, it suggests agriculture as a likely dominant source. Since 2014, atmospheric concentrations of methane have begun to track the most carbon-intensive pathways developed for the 21st century by the Intergovernmental Panel on Climate Change (IPCC). |
|
 |
Anthropogenic Emissions |
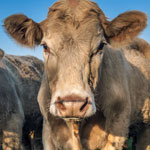
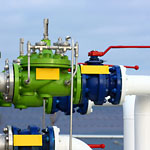
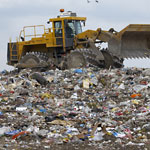
About 60% of all methane emissions come from anthropogenic sources with a total of 352 (340-360) Tg CH4 (bottom-up estimates) for the decade 2003-2012. The most important sources are emissions from agriculture and waste (55% from total anthropogenic emissions) with enteric fermentation and manure being the most important sources. Extracting and processing fossil fuels account for about 34%. |
|
 |
Natural Emissions |
Natural emissions of CH4 are 384 (257-524) Tg CH4 for the decade of 2003-2012 and are dominated by emissions from wetlands (48%). Freshwater bodies such as lakes and rivers account for about 32%, followed by geological sources such as terrestrial and marine seeps and volcanoes with 14% of the total natural emissions. Other smaller sources include ruminant wild animals, termites, hydrates and permafrost. |
|
 |
Sinks |
A number of chemical and biological processes in the atmosphere and soils consume CH4 and therefore are the sinks of CH4. The primary sink is oxidation by hydroxyl radicals (OH), mostly in the troposphere, accounting for about 90% of the global methane sink. Additional sinks include methanotrophic bacteria in aerated soils, reactions with chlorine radicals and atomic oxygen radicals in the stratosphere, and reactions with chlorine radicals from sea salt in the marine boundary layer. Sinks for the 2003-2012 decade are estimated to be about 548 Tg CH4 per year. |
|
 |
Uncertainties |
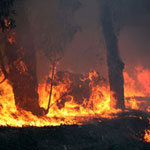
For the period 2002-2013, the uncertainty range for bottom-up estimates — defined as (max−min)/mean — is 40% for natural wetlands and typically 100% for other smaller natural sources. Anthropogenic sources are better known, with an uncertainty range of 15% for agriculture/waste, and 20% for fossil fuel related emissions, and 30% for biomass burning. The uncertainty range of the global sink is large. Natural wetlands have the largest absolute uncertainty of any of the emission categories, with a min–max range of 74 Tg CH4 per year in the bottom-up approach (153−227 Tg CH4 per year). Overall, higher confidence in global emissions is found for agriculture and waste (top-down) than for fossil fuels, the OH sink, natural wetlands and other natural sources. |
|
 |
Outlook |
There are opportunities and challenges ahead. The opportunity lies in the possibility of developing short-term climate change mitigation policies that take advantage of the relatively short atmospheric lifetime of CH4 of about 10 years, and the known technological and agronomical options available for reducing emissions. The challenges include the potential intensive exploitation of natural gas from shale formations around the world that could lead to significant additional CH4 release if leakage rates are left uncapped. In the longer term, the thawing of permafrost and methane hydrates could increase CH4 emissions, and introduce large positive feedbacks to long-term climate change. A better and regular quantification of the global CH4 budget and its attribution to sources and sinks is key to embracing the opportunities and meeting the challenges. |